


Click to explore
The Quality Dashboard provides a comprehensive view of workplace quality metrics, emphasizing quality compliance performance to plan, focused insights for timely risk identification + mitigation, and ability to self-assess.
Additionally, filters by site and duration allow for customized analysis, ensuring visibility into location-specific and time-dependent safety trends while the dashboard also integrates status updates and risk/recovery planning for operational excellence.
The dashboard incorporates a weighted performance index to track trends over time, offering insights into overall QMS performance over time.
"Transition away from traditional QMS where the bulk of time is spent updating KPI's with trends communicated periodically in Quality Management Review (QMR) to proactive near real time monitoring with time spent on sustainability + mitigation/recovery actions "
CAPA Management Dashboard Summary


This CAPA (Corrective and Preventive Action) dashboard is designed to provide a concise, real-time view of the health of the CAPA process by tracking key performance indicators that align with regulatory expectations and operational excellence. The selected metrics support proactive oversight, drive accountability, and help identify systemic barriers to closure and effectiveness.
📊 Key Measures – Purpose and Value
-
New / Open / Overdue CAPAs: Provide visibility into CAPA volume and workload while identifying potential bottlenecks or resource gaps.
-
CAPA Effectiveness Rate: Measures the quality and sustainability of implemented corrective actions, ensuring true root cause resolution and prevention of recurrence.
-
CAPA % On Time: Evaluates timeliness and rigor in executing CAPAs within established due dates.
-
Open CAPA Aging: Highlights long-standing CAPAs that may be artificially “on time” due to repeated extensions, helping uncover hidden risk or inaction.
-
Time to Closure: Focuses on overall cycle time, driving urgency and preventing excessive duration from masking systemic issues.
-
Extensions per CAPA: Tracks planning discipline and integrity in the system by identifying excessive or avoidable deadline extensions, which could undermine on-time performance metrics.
-
Stage Distribution (INV, IMP, EC:): Categorizing CAPAs by phase enables early detection of delays, ensures CAPAs are actively progressing, and flags any stage-specific bottlenecks.
-
Department-Level Ownership: Highlights which functions are responsible for driving CAPAs forward, enabling targeted coaching, resource planning, or escalations where needed.
📈 Trend Indicators – Strategic Use
Visual trends across these KPIs are used to evaluate system maturity, performance consistency, and risk exposure over time. Three-month moving averages help smooth variability and identify sustained improvements or emerging issues. The integrated view supports operational teams and quality leadership in driving continuous improvement, prioritizing resource allocation, and reinforcing accountability within the quality system.
Deviation Management Dashboard Summary


This Deviation (DV) Management dashboard provides a comprehensive, real-time view of deviation lifecycle performance and quality system responsiveness. The key measures have been selected to ensure early detection, timely closure, and meaningful classification of deviations, with an emphasis on risk-based management and operational transparency.
📊 Key Measures – Purpose and Value
-
DV % Closed On Time: Reflects ability to adhere to internal DV closure timelines and regulatory expectations, reinforcing accountability.
-
DV >30D Aging: Often used as a benchmark for risk-based escalation and visibility in regulatory inspections.
-
DV Open Aging (Days): Provides a broader view of how long deviations remain unresolved on average, assessing system throughput and resource efficiency.
-
Occur to Detect Average: Measures the time lag between deviation occurrence and identification, highlighting the effectiveness of monitoring controls and process oversight.
-
% Major + Critical Deviations: Quantifies the severity profile of reported deviations, informing risk trends, operational maturity, and areas requiring targeted CAPAs or enhanced controls.
-
Deviation status by Department: Provides progression by department across the key stages in completing the Deviation.
📈 Trend Monitoring – Strategic Use
The dashboard includes monthly trend tracking enabling structured follow-up for any metrics that begin to trend unfavorably. Visualizing trends over time ensures not only consistent performance but also identifies patterns that support continuous improvement efforts and proactive risk mitigation.
🧩 Integrated Insights
By combining compliance measures (aging, timeliness), process indicators (detection lag), and severity classification, this dashboard supports both quality assurance and operational leadership in maintaining an agile, compliant deviation system. It reinforces the principles of right-first-time culture, system maturity, and readiness for internal and regulatory audits.

Change Control Dashboard Summary


The Change Control dashboards are designed to provide real-time insight into the effectiveness, responsiveness, and control of the change management process. By monitoring critical lifecycle and timeliness indicators, these dashboards enable quality and operational leaders to maintain a compliant, risk-based, and efficient change control system.
📊 Key Measures – Purpose and Value
-
CC Actions On Time: Measures adherence to committed timelines across all phases of change control, reinforcing execution discipline and audit readiness.
-
CC Aging < 9 Months: Helps ensure change controls are resolved within an industry-appropriate timeframe to prevent long-standing open records from masking execution gaps.
-
% Initiated Within 30 Days: Reflects how quickly required changes are being formally initiated following identification, supporting timely impact assessments and planning.
-
Initiate to Approval Cycle Time: Tracks the speed of progressing from request to formal approval, identifying delays in cross-functional engagement or governance.
-
% Urgent: Assesses the proportion of urgent change controls, which may indicate reactive behavior, lack of planning, or need for pre-emptive risk assessments.
🧩 Lifecycle + Department Distribution Insights
The second dashboard visualizes the volume of change controls by lifecycle phase (Initiation, Approval, Implementation) and maps them to departmental ownership. This structure provides transparency into workload distribution, identifies potential bottlenecks, and supports more effective cross-functional coordination.
Additional columns for Overdue Actions, Initiation >30 Days, and Aging >9 Months further reinforce accountability and prioritize aging records for escalation.
📈 Strategic Value
Collectively, these measures promote a culture of structured change, enhance visibility into execution barriers, and ensure alignment with internal and regulatory expectations for timely and controlled changes. When used consistently, they support continuous improvement by identifying patterns in late initiations, prolonged implementations, or recurring urgency flags — enabling teams to shift from reactive to preventive behaviors.
Complaints Dashboard Summary


The Complaints Management dashboard is structured to monitor the timeliness, responsiveness, and quality of complaint handling, aligning customer experience with regulatory expectations. These KPIs provide visibility into operational efficiency and stakeholder satisfaction while driving a culture of accountability and continuous improvement.
📊 Key Measures – Purpose and Value
-
Complaints Resolved On Time: Tracks adherence to internal and regulatory resolution timelines, reinforcing process discipline + minimizing risk.
-
Complaint Time to Close: Measures the full resolution cycle time, ensuring that complaints are not only addressed promptly but also thoroughly investigated and closed with quality.
-
Complaint Rate: Reflects the frequency of customer-reported issues relative to volume of business, allowing early detection of product or service trends that may impact quality.
-
Complaint Aging: Monitors the average time complaints remain open, identifying bottlenecks and flag systemic issues that may delay resolution.
-
Complaint Resolution Customer Satisfaction: Provides insight into the quality of closure from the customer’s perspective, ensuring that resolution efforts meet expectations and drive loyalty.
📈 Strategic Use of Trend Data
Monthly trending allows leaders to track performance improvement over time, spot outliers, and prioritize escalation pathways when KPIs deviate from target. Risk/Recovery Plan placeholders enable structured mitigation efforts, linking corrective actions directly to process metrics.
💡 Operational Insight
This dashboard supports both compliance and business goals by providing end-to-end visibility into complaint management. It fosters cross-functional collaboration, ensures timely and effective response to issues, and provides actionable insight into areas where proactive improvements can prevent recurrence or elevate the customer experience.
Interval Actions Dashboard Summary


The Interval Actions dashboard provides structured oversight of scheduled preventive activities such as validation (qualifications, requalification's and periodic reviews), calibration, and preventive maintenance (PM). By tracking performance across schedule adherence, overdue actions, and extended holds, the dashboard ensures essential GMP activities are completed on time, risks are proactively managed, and operational readiness is maintained.
📊 Key Measures – Purpose and Value
-
Schedule Adherence (Validation, Calibration, PM): Reflects timely completion of routine interval tasks, critical to ensuring equipment, systems, and processes remain compliant and in a validated state.
-
Critical vs. Non-Critical Overdue: Prioritizes overdue actions by risk level, allowing quality + operations teams to escalate critical misses while triaging less-risky delays.
-
Overdue Tasks by Category: Tracks how many actions (validation, calibration, PM) are past due, providing insight into resource constraints, backlog, or scheduling issues.
-
On Hold >30 Days: Monitors actions delayed beyond 30 days, indicating either planning/approval barriers or capacity/resource gaps. This metric supports risk-based reviews and targeted recovery planning.
📈 Operational and Strategic Value
This dashboard enables Quality and Facilities/Engineering leadership to maintain inspection readiness and reduce operational risk by highlighting early warning indicators for missed or delayed interval tasks. The breakdown by action type and severity supports focused resource allocation and cross-functional alignment.
With embedded trend charts (12-month view) and a risk/action tracker, the dashboard reinforces a closed-loop management system — where issues are tracked to resolution and long-term planning can adapt to trend-based risks.


Batch Release Dashboard Summary

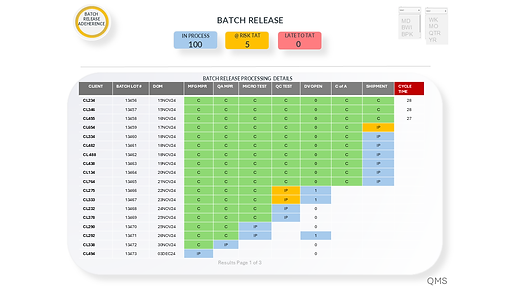

The Batch Release dashboards provide critical, real-time insights into the efficiency, accuracy, and reliability of the end-to-end product release process. By monitoring adherence to timelines, quality review performance, and release cycle consistency, these metrics ensure that product availability is achieved without compromising compliance or customer satisfaction.
📊 Key Measures – Purpose and Value
-
On-Time Release: Measures whether batches are released to target timelines, ensuring supply continuity and adherence to customer commitments.
-
Release Cycle Time: Tracks the total days from mfg completion to product release, evaluates process efficiency and identify areas of delay or improvement.
-
Right First Time (MPR Review): Indicates the % of batch records reviewed without rework or error, reflecting documentation quality and reducing cycle delays.
-
Deviations per MPR: Measures frequency of DV per batch record, signaling process stability and identifying opportunities for root cause and reduction.
-
Success Rate: Reflects the overall performance of the release process — including documentation, testing, deviation closure, and CoA issuance — culminating in timely product release.
📦 Batch Release Status Grid – Purpose and Interpretation
The release processing table presents batch status across key checkpoints: manufacturing, QA review, testing, deviation handling, and shipment. Metrics include:
-
In Process: Provides visibility into current workload and where batches reside in the review or testing cycle.
-
@ Risk to TAT / Late to TAT: Flags batches approaching or missing expected turnaround targets, allowing for proactive escalation or reallocation of resources.
-
Aging Days: Captures how long batches remain in each stage, highlighting bottlenecks across QA, QC, or logistics that may affect OTIF delivery.
🧩 Strategic and Operational Value
Together, these dashboards support a data-driven release management approach, helping cross-functional teams — including QA, QC, Operations, and Supply Chain — maintain batch flow, reduce delays, and uphold compliance. The inclusion of risk flags, aging, and performance trends equips leadership with the tools needed for agile decision-making and continuous process optimization.
Training + OJT Dashboard Summary


Maintaining timely and effective training is critical for ensuring regulatory adherence and operational excellence. This dashboard provides visibility into training completion rates, overdue sessions, and departmental performance trends, allowing proactive action to mitigate delays. By continuously tracking training compliance, organizations can strengthen workforce readiness while reducing risks associated with knowledge gaps.
📊 Training Compliance
-
Training Completed On Time: Measures adherence to training deadlines, ensuring workforce competency and regulatory compliance.
-
Training Completion Rate: Tracks the percentage of employees who successfully complete training within the required timeframe.
-
Training Aging: Monitors overdue training sessions, identifying delays that may impact operational efficiency.
-
Training Late Trends: Helps pinpoint recurring delays in different departments, allowing proactive intervention.
-
Training Effectiveness: Assesses post-training proficiency to ensure that learning objectives translate into improved performance.
📈 Strategic Use of Trend Data
-
Monthly tracking highlights departmental performance variations, enabling leaders to focus on improving training outcomes.
-
The Risk/Recovery Plan framework links corrective actions to training compliance metrics, supporting continuous improvement.
💡 Operational Insight
-
A well-executed training program strengthens regulatory alignment and operational readiness.
-
Insights from training compliance trends help refine onboarding and retraining strategies to maximize workforce capabilities.
Audit Management Dashboard Summary

Effective audit management is essential for maintaining compliance, identifying process gaps, and driving continuous improvement. This dashboard provides insight into audit completion rates, corrective action effectiveness, and the timeliness of observation resolutions. By actively monitoring audit KPIs, organizations can ensure regulatory alignment, strengthen quality systems, and enhance operational transparency.
📊 Audit Management
-
Audit Observation On-Time Completion: Tracks the timeliness of resolving audit observations, ensuring compliance and accountability.
-
Audit Aging: Monitors the duration of open audit items, flagging bottlenecks that may delay resolution.
-
Audit Effectiveness: Measures the impact of corrective actions stemming from audits, ensuring meaningful process improvements.
-
CAPA Time to Closure: Evaluates the speed of corrective action implementation following audit findings.
-
Audit Compliance Rate: Reflects adherence to scheduled audit requirements, highlighting consistency in governance and oversight.
📈 Strategic Use of Trend Data
-
Monthly tracking allows leaders to identify trends in audit completion and CAPA effectiveness.
-
The Risk/Recovery Plan framework ensures actions are structured and linked to audit metrics, supporting continuous improvement.
💡 Operational Insight
-
Strong audit management enhances compliance posture and mitigates regulatory risks.
-
Actionable insights from audit trends facilitate proactive issue resolution, strengthening overall quality systems.
Doc Control Management Dashboard Summary

Effective document control ensures streamlined lifecycle management, regulatory compliance, and operational efficiency. By monitoring key metrics such as document issuance accuracy, revision cycles, and archival processes, organizations can optimize workflow reliability and enhance procedural integrity. This dashboard enables leaders to proactively address documentation delays while maintaining compliance with industry standards.
📊 Document Control
-
Document Lifecycle Management: Ensures controlled document handling, including timely creation, revision, approval, and archival.
-
Periodic Review On-Time Completion: Tracks document updates, minimizing risks associated with outdated procedures.
-
Document Issuance Right First Time (RFT): Measures accuracy in document processing to prevent unnecessary revisions.
-
Document Request Timeliness: Monitors efficiency in responding to documentation requests, improving workflow reliability.
-
Document Aging & Revision Cycle: Flags delays in document approval cycles, mitigating compliance risks.
📈 Strategic Use of Trend Data
-
Lifecycle trends reveal process bottlenecks, guiding interventions to improve document turnaround time.
-
The Risk/Recovery Plan integrates corrective actions with lifecycle KPIs, ensuring regulatory adherence and operational efficiency.
💡 Operational Insight
-
Effective document management enhances compliance and quality control, reducing regulatory risks.
-
Proactive tracking of documentation trends optimizes revision cycles and strengthens procedural integrity.
Supplier Quality Management Dashboard Summary

Supplier quality management is essential for maintaining product consistency, regulatory compliance, and operational reliability. This dashboard provides insight into audit completion rates, corrective action response times, and supplier issue resolution efficiency. By proactively tracking supplier KPIs, organizations can strengthen supplier partnerships, minimize risks, and improve overall material reliability.
📊 Supplier Quality
-
Audit Observation On-Time Completion: Ensures timely resolution of supplier audit findings, reinforcing quality assurance.
-
Supplier Corrective Action Response (S-CAR) Aging: Monitors the timeliness of supplier corrective actions, mitigating risks in procurement.
-
Lot Acceptance Rate: Evaluates supplier product quality, ensuring consistency in material reliability.
-
Approved Supplier List (ASL) Audits Completed: Tracks supplier audits, maintaining oversight on approved vendors.
-
Supplier Issue Resolution Rate: Measures responsiveness and effectiveness of supplier corrective actions.
📈 Strategic Use of Trend Data
-
Supplier performance trends aid in risk management, allowing proactive interventions to maintain compliance.
-
The Risk/Recovery Plan framework enhances supplier accountability and helps resolve recurring quality issues.
💡 Operational Insight
-
Strengthening supplier quality management minimizes disruptions and enhances procurement efficiency.
-
Continuous monitoring fosters collaborative supplier partnerships while driving sustainable improvements in quality assurance.