

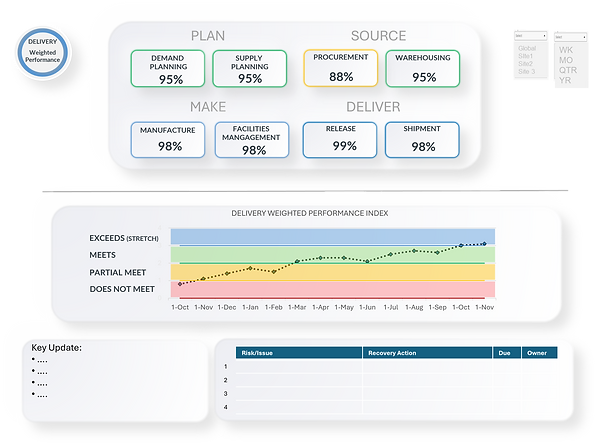
This dashboard provides a comprehensive view of Delivery Weighted Performance, tracking key metrics across planning, sourcing, manufacturing, and delivery functions. By monitoring performance trends, organizations can ensure operational efficiency, maintain high-quality standards, and drive continuous improvement. The structured approach helps align execution with business objectives while mitigating risks.
The Delivery Weighted Performance Index tracks performance trends over time, categorizing results into four bands: Exceeds (Stretch), Meets, Partial Meet, Does Not Meet
The Key Update section provides space for tracking risks, recovery actions, due dates, and ownership, ensuring accountability. Continuous monitoring of these metrics supports proactive decision-making, optimizing supply chain efficiency and execution reliability
PLAN: DEMAND PLANNING

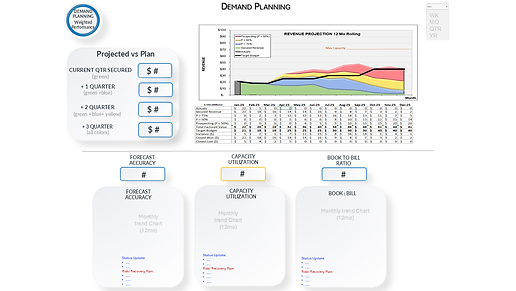
📊 Demand Planning Summary
The Time-Phased Demand & Supply Plan ensures that forecasted demand is balanced with available supply while achieving revenue targets across multiple quarters. By integrating secured revenue and probability-based forecasting, this approach strengthens inventory optimization, production alignment, and procurement efficiency while mitigating risks. Continuous tracking of factored risks and opportunities allows organizations to proactively manage revenue fluctuations, enhance financial resilience, and drive sustainable growth.
Time-Phased Demand & Supply Plan – Summary
📊 Key Components
-
Demand Forecasting: Tracks expected product demand across multiple quarters for accurate planning.
-
Supply Planning: Aligns procurement, production, and inventory to prevent shortages or excess stock.
-
Revenue Targets by Quarter:
-
Current Quarter: Secured revenue exceeds target revenue.
-
+1 Quarter: Secured revenue + Pwin >75% exceeds target revenue.
-
+2 Quarters: Secured revenue + Pwin >75% + Pwin >50% exceeds target revenue.
-
+3 Quarters: Secured revenue + all probability factors exceed target revenue.
-
-
Capacity Utilization: Ensures production aligns with demand without exceeding operational limits.
-
Lead Time Optimization: Adjusts supplier and manufacturing replenishment cycles for efficiency.
⚠️ Risk Mitigation Strategies
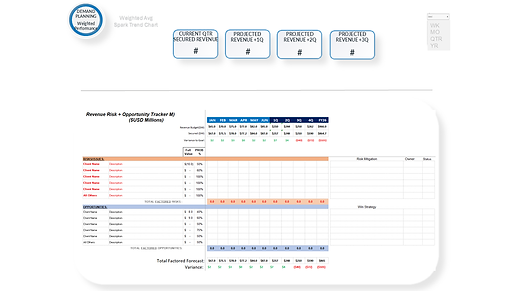
The Revenue Risk & Issue Tracker provides a structured approach to monitoring and addressing revenue fluctuations:
-
Factored Risk & Mitigation Plan: Identifies revenue risks, quantifies their impact, and outlines mitigation strategies.
-
Factored Opportunities & Achievement Plan: Highlights revenue growth opportunities, assigns probability factors, and tracks execution strategies.
-
Adjusted Revenue Projection: Combines secured revenue, risk-adjusted revenue, and opportunity-adjusted revenue to ensure forecasts exceed target revenue.
📈 Strategic Use of Trend Data
-
Demand vs. Supply Variance Analysis supports proactive revenue achievement strategies.
-
Inventory Turnover Metrics ensure efficient stock movement + minimize costs.
-
Risk vs. Opportunity Balancing ensures revenue risks are mitigated while leveraging growth opportunities.
-
Probability-Based Forecasting refines revenue projections using weighted prob.
-
Scenario Planning allows organizations to adjust strategies based on market dynamics.
💡 Operational Insight
Integrating secured revenue thresholds with probability-driven forecasting enhances data-driven decision-making, cost-effective inventory management, and strategic business alignment. Continuous monitoring enables early intervention to ensure target achievement remains on track. By tracking factored risks and opportunities, organizations can proactively manage revenue fluctuations, strengthen financial resilience, and drive sustainable growth.
PLAN: SUPPLY PLANNING


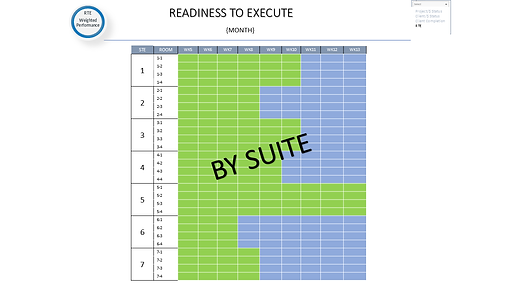
📦 Supply Planning Summary
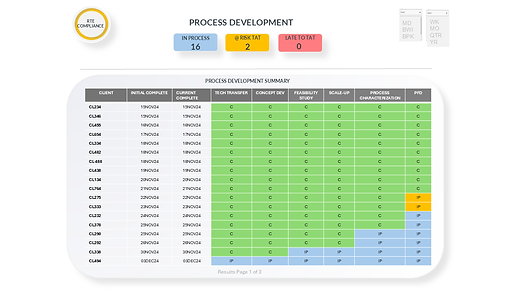
The Supply Planning Dashboard ensures streamlined alignment of material availability, process readiness, and manufacturing efficiency. By tracking weighted performance metrics, molecule campaign status, and readiness indicators, this structured approach optimizes resource allocation, procurement efficiency, and operational continuity while mitigating risks. Each aspect of readiness—process, analytical, material, documentation, facility, and resource—plays a critical role in ensuring successful execution of pharmaceutical manufacturing.
Supply Planning Dashboard – Summary
📊 Key Components
-
Supply Planning Weighted Performance: Aggregates performance metrics across readiness categories to ensure supply alignment.
-
Process Development: Tracks key deliverables and milestones to confirm process scalability and validation progress.
-
Analytical Development: Ensures analytical methods are validated and transferred, supporting batch release and regulatory compliance.
-
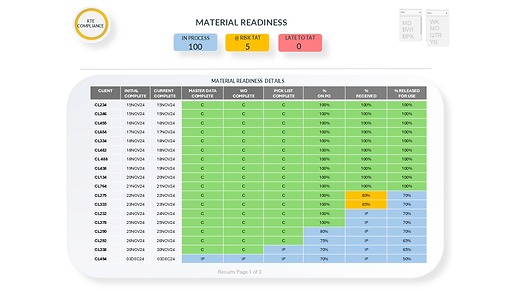
Material Readiness: Monitors critical raw material inventory levels to prevent production delays.
-
Document Readiness (BOM, MPR, Specifications): Ensures all documentation is in place for compliant manufacturing execution.
-
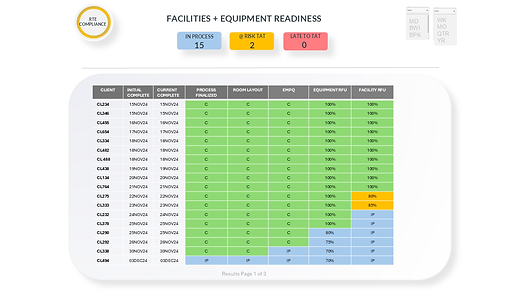
Facilities & Equipment Readiness: Confirms operational availability and qualification of manufacturing infrastructure.
-
Resource Readiness: Verifies personnel availability and skill alignment for campaign execution.
🏆 Performance Tracking by Molecule Campaign
-
Molecule Campaign Statusing: Tracks readiness by molecule to ensure alignment with production timelines.
-
Performance to Plan: Measures campaign progression against predefined schedules and deliverables.
🚀 Strategic Risk & Opportunity Management
-
Supply vs. Demand Variance Analysis: Identifies gaps to proactively address supply constraints.
-
Lead Time Optimization: Adjusts procurement and replenishment cycles to improve efficiency.
-
Capacity Planning: Ensures available resources align with production demands.
-
Scenario Planning: Supports adjustments based on shifting supply chain dynamics.
💡 Operational Insight
By integrating supply readiness metrics across process, material, analytical, facility, and resource domains, organizations can optimize inventory management, mitigate operational risks, and enhance production continuity. Continuous monitoring allows early intervention, ensuring molecule campaign execution remains on track and strategic supply objectives are met efficiently


SOURCE: PROCUREMENT



🛒 Procurement Planning Summary
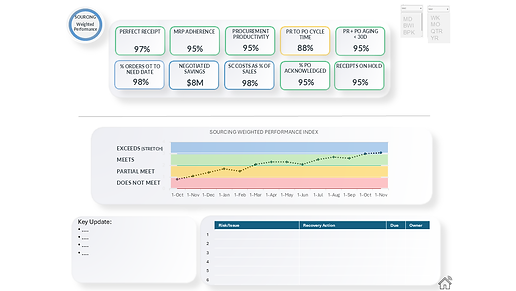
The Procurement Dashboard focuses on supplier performance, material readiness, and cost optimization, ensuring timely availability of critical inputs for pharmaceutical campaigns. By tracking procurement efficiency, spend management, and supplier reliability, this approach enhances supply continuity, strategic sourcing, and operational agility while mitigating risks.
📊 Key Components
Sourcing Dashboard
-
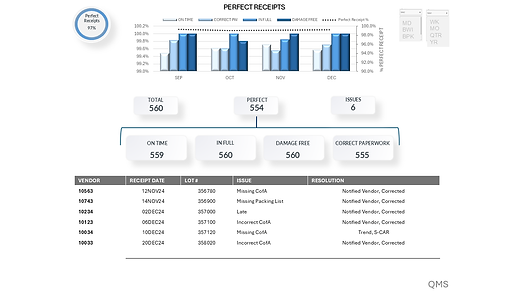
Perfect Receipt: Measures the percentage of materials received without errors or discrepancies, ensuring alignment with purchase order requirements.
-
MRP Adherence: Tracks how closely supply chain activities align with system-generated material requirements planning (MRP) signals, promoting inventory and planning accuracy.
-
Procurement Productivity: Reflects the efficiency of the procurement function in terms of purchase order volume managed per buyer or per resource.
-
PO Release per Buyer/Wk
-
Spend per Buyer ($)
-
Line Items per PO
-
Spend per PO ($)
-
Average cost per PO
-
% spend on negotiated contract
-
% PO Right First Time
-
-
PR to PO Cycle Time: Measures the speed of converting purchase requisitions into purchase orders, indicating the responsiveness of the procurement process.
-
PR + PO Aging < 30D: Monitors the percentage of open PRs and POs that are processed or closed within 30 days, highlighting backlog or process health.
-
% Orders On Time to Need Date: Tracks the proportion of material deliveries that meet their required need dates, supporting uninterrupted production and planning reliability.
-
Negotiated Savings: Captures the total cost savings achieved through supplier negotiation or sourcing strategies over a defined period.
-
SC Costs as % of Sales: Represents the proportion of supply chain-related expenses relative to total sales, providing a benchmark for operational cost efficiency.
-
% PO Acknowledged: Indicates the percentage of purchase orders confirmed by suppliers, ensuring visibility and commitment to supply terms.
-
Receipts on Hold: Tracks the percentage of inbound materials placed on quality or administrative hold, highlighting potential disruptions in material availability.
-
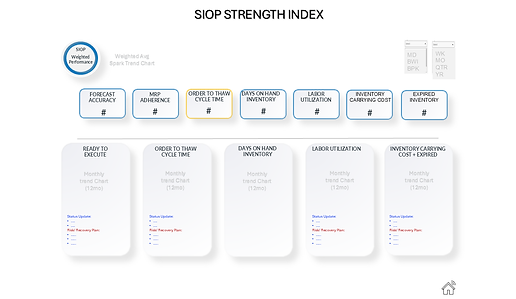
SIOP Strength Index: Provides scorecard summary for SIOP highlighting key measures
-
Forecast Accuracy
-
MRP Adherence
-
Order to Thaw Cycle Time
-
Days on Hand Inventory
-
Capacity Utilization
-
Labor Utilization
-
Inventory Carrying Cost
-
Scrap as % of Sales
-
Slow moving Inventory ( no demand + >12 mo aging
-
Expired + Obsolete Inventory ($)
-
-
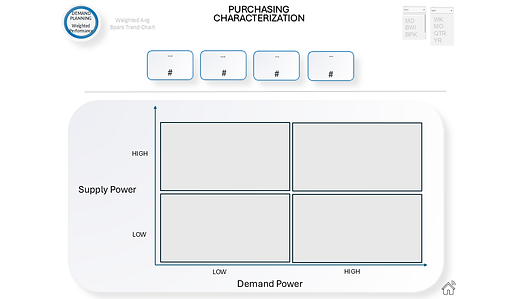
Purchasing Characterization: Supply base listed into respective quadrant based upon Supply Power ( how much market share, single or sole source) and Demand Power (% of our spend vs total- what % of supplier business do we represent). This drives procurement strategies.
💡 Operational Insight
By integrating procurement readiness metrics across supplier, material, and spend categories, organizations can ensure cost-effective sourcing, uninterrupted production, and supply chain agility. Continuous monitoring enables proactive decision-making, ensuring procurement performance remains aligned with operational targets.

PLAN: WAREHOUSING


The dashboard presents a comprehensive view of warehousing performance, tracking key efficiency and accuracy metrics. Notable improvements include enhanced On Time In Full (OTIF) delivery and Dock to Stock Cycle Time (DTS CT), while declines in Inventory Accuracy and Quarantine Release Cycle Time highlight areas requiring attention. The insights provide strategic direction for process optimization and compliance alignment.
📊 Key Measures – Purpose and Value
-
% On Time In Full (OTIF): Ensures timely and complete deliveries to enhance supply chain reliability and customer satisfaction.
-
Lot Acceptance Rate (LAR): Reflects product quality at receipt, directly impacting compliance and minimizing rework costs.
-
Dock to Stock Cycle Time (DTS CT): Measures efficiency in integrating inbound inventory, accelerating production readiness.
-
Quarantine Release Cycle Time: Tracks how quickly materials clear quality checks, reducing delays in availability for operations.
-
Inventory Accuracy: Validates the precision of stock records, preventing shortages, excesses, and operational inefficiencies.
-
Work Order (WO) Fill Rate On-Time %: Ensures materials are available as scheduled, maintaining smooth manufacturing execution.
-
WO Pick Accuracy: Measures correctness in order fulfillment, reducing errors and improving downstream process efficiency.
-
Average Picks per Hour: Evaluates workforce efficiency in order processing, directly affecting throughput and labor utilization.
-
Utilization Rate: Gauges resource usage effectiveness, optimizing warehouse space and equipment productivity.
-
Inventory Turns: Tracks how frequently stock is replenished, balancing operational efficiency with cost management
📈 Trend Monitoring – Strategic Use
-
Weighted Performance Index: Categorized into performance tiers (Exceeds Stretch, Meets, Partial Meet, Does Not Meet).
-
KPI Trends: Visual comparisons of targets versus actuals for OTIF, WO Fill Rate, LAR, WO Pick Accuracy, DTS CT, Avg Picks per Hour, Quarantine Release Cycle Time, Utilization Rate, Inventory Accuracy, and Inventory Turns.
-
Areas of Notable Change: Declines in quarantine release cycle time and inventory accuracy warrant investigation into systemic causes.
🧩 Integrated Insights
-
The improvement in OTIF and DTS CT underscores enhanced logistics efficiency.
-
Reductions in LAR and inventory accuracy indicate a need for stricter quality control measures.
-
Stable inventory turns and WO efficiency highlight consistent operational effectiveness.
-
Addressing quarantine clearance delays can further improve material readiness and lead times.
MAKE: MANUFACTURE

This Manufacturing Dashboard provides a comprehensive, weighted view of operational performance across critical production KPIs. By tracking both efficiency and quality in real time, it empowers leadership to maintain control of throughput, cost, and compliance while driving continuous improvement in resource utilization and execution reliability.
📊 Key Measures – Purpose and Value
-
Success Rate: Measures the percentage of batches completed without failure or rework, representing the overall health of execution and yield reliability.
-
OEE (Overall Equipment Effectiveness): Captures how efficiently equipment is utilized by integrating availability, performance, and quality, providing a holistic view of productivity losses.
-
Schedule Adherence: Tracks how closely manufacturing output aligns with the planned schedule, ensuring supply continuity and production discipline.
-
Capacity Utilization: Reflects how effectively the plant's capacity is being used, informing planning efficiency and potential for scale or constraint.
-
Right First Time: Measures how often batches are executed without requiring deviation or rework, directly impacting compliance, cost, and cycle time.
-
DV per Batch: Tracks the average number of deviations per batch, serving as a quality and process stability indicator.
-
Overall Labor Effectiveness: Evaluates workforce productivity by comparing actual vs. planned labor output, supporting labor planning, accountability, and efficiency.
📈 Trend Monitoring – Strategic Use
Twelve-month rolling trend charts provide visibility into directional changes, highlight improvements or regression, and serve as early warning indicators. These trends support timely interventions, validate the impact of corrective actions, and enable data-driven decisions during daily Tier meetings and monthly operational reviews.
🧩 Integrated Insights
This dashboard integrates multiple performance lenses — quality, efficiency, and labor — into a single framework, enabling holistic performance evaluation and cross-functional alignment. Combined with the embedded risk/action tracker, it enables closed-loop management of operational issues, bridging the gap between frontline performance and executive visibility.
DELIVER: RELEASE


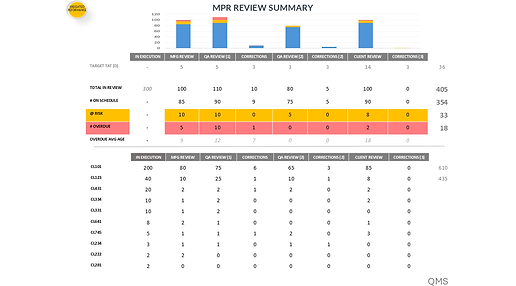
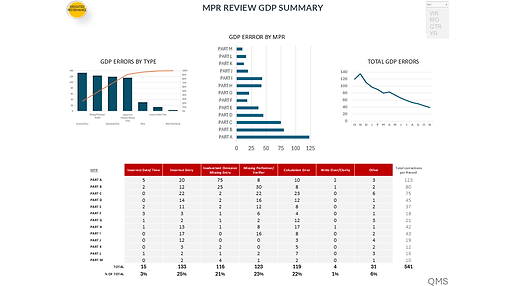
These dashboards provide a structured assessment of batch release adherence, batch record review performance, and GDP documentation accuracy across clinical and commercial operations. By integrating batch release tracking, MPR review metrics, and GDP error trends, teams can proactively manage release timelines, documentation quality, and deviation reduction efforts.
📊 Key Measures – Purpose and Value
Batch Release Metrics
-
Batch Release Adherence: Tracks release completion status across multiple batches, categorizing them into In Process, At Risk TAT, and Late to TAT, ensuring timely batch progression.
-
On-Time Release: Monitors the percentage of batches successfully released on schedule, reinforcing process discipline and timely product availability.
-
Release Cycle Time: Measures turnaround time from batch execution to final release, highlighting bottlenecks and efficiency opportunities.
-
Batch Processing Details: Provides detailed visibility into batch lot numbers, manufacturing steps, quality reviews, micro and QC testing, deviation status, certificate of analysis (CoA) completion, and shipment readiness.
-
Deviation per Batch Record (DV/MPR): Evaluates documentation-related deviations affecting release timelines, ensuring process robustness and compliance standards.
-
Success Rate: Measures the percentage of batches that are releasable, serving as a critical indicator of overall batch processing integrity.
MPR Review Metrics
-
Right First Time (RFT) Review: Reflects documentation accuracy at Manufacturing, QA Review, and Final Release stages, ensuring completeness and minimizing rework.
-
Turnaround Time Efficiency: Tracks batch record review cycle time, supporting streamlined release readiness.
-
MPR Aging & Step Adherence: Monitors delays in batch review steps, flagging overdue records and identifying procedural bottlenecks.
GDP Error Metrics
-
GDP Errors by Type: Categorizes errors into Incorrect Entry, Calculation Error, Omission/Missing Entry, Missing Performer/Verifier, Write Over/Clarity, Incorrect Date/Time, and Other, informing corrective action priorities.
-
GDP Errors by MPR Section: Tracks errors across PART A–PART M, pinpointing systemic gaps and areas requiring retraining or documentation standardization.
-
Total GDP Errors Over Time: Rolling trend analysis ensures teams can evaluate documentation stability and improvement efforts.
📈 Trend Monitoring – Strategic Use
-
Batch Release & Documentation Trends Month-over-month tracking provides real-time insights into release timelines, documentation stability, and GDP compliance rates.
-
Success Rate & Deviation Reduction Improvement in On-Time Release and Right First-Time rates signals strengthened execution control, while reductions in DV/MPR highlight enhanced deviation management.
-
GDP Error Trends Declining GDP errors indicate stronger documentation control, while persistent gaps call for process optimization and retraining initiatives.
🧩 Integrated Insights
This dashboard bridges batch release performance, batch record review accuracy, and GDP error tracking to ensure operational alignment across Manufacturing, Quality, and Compliance. Key takeaways include: ✅ Streamlining batch release workflows by improving milestone adherence and reducing turnaround delays. ✅ Minimizing GDP documentation errors through structured remediation strategies and targeted retraining. ✅ Enhancing release reliability by reinforcing deviation control and proactive risk mitigation approaches.
By incorporating insights from your document alongside previous images, this summary ensures a comprehensive monitoring strategy, supporting clinical and commercial production goals.
DELIVER: PERFECT ORDER

The Perfect Order Dashboard tracks commercial and clinical shipment performance, ensuring alignment with delivery reliability, accuracy, and risk mitigation. By monitoring on-time delivery, order accuracy, and damage-free shipments, the dashboard enhances supply chain visibility, recovery planning, and operational efficiency.
📊 Key Components
-
Perfect Order Weighted Performance: Aggregates shipment quality, timeliness, and completeness across commercial and clinical categories.
-
Commercial Orders: Monitors on-time delivery, complete order fulfillment, order accuracy, and damage-free shipments.
-
Clinical Orders: Tracks on-time performance, complete fulfillment, order precision, and damage-free deliveries.
-
Monthly Trend Charts (12-Month): Displays shipment performance trends for commercial and clinical categories.
-
Risk & Issue Tracking: Identifies shipment challenges, outlines recovery actions, assigns ownership, and sets due dates.
🚀 Strategic Risk & Recovery Planning
-
Delivery Performance Monitoring: Ensures shipment alignment with expected arrival times and accuracy.
-
Issue Management & Recovery Tracking: Logs shipment risks, corrective measures, and responsible owners for resolution.
-
Trend Analysis for Optimization: Enables data-driven improvements in shipment reliability and efficiency.
💡 Operational Insight
By integrating shipment quality, timeliness, and recovery tracking, organizations enhance delivery accuracy, mitigate risks, and ensure supply continuity. Continuous monitoring supports proactive issue management, improving commercial and clinical logistics performance.